· Life · 7 min read
My Sports Year 2025
A data-driven deep dive into a high-volume sports year of 700 active hours, balancing semiprofessional basketball with cycling and strength training, comparing 2025 metrics against 2024.
2025 Year in Review: Basketball, Cycling & Data (vs. 2024)
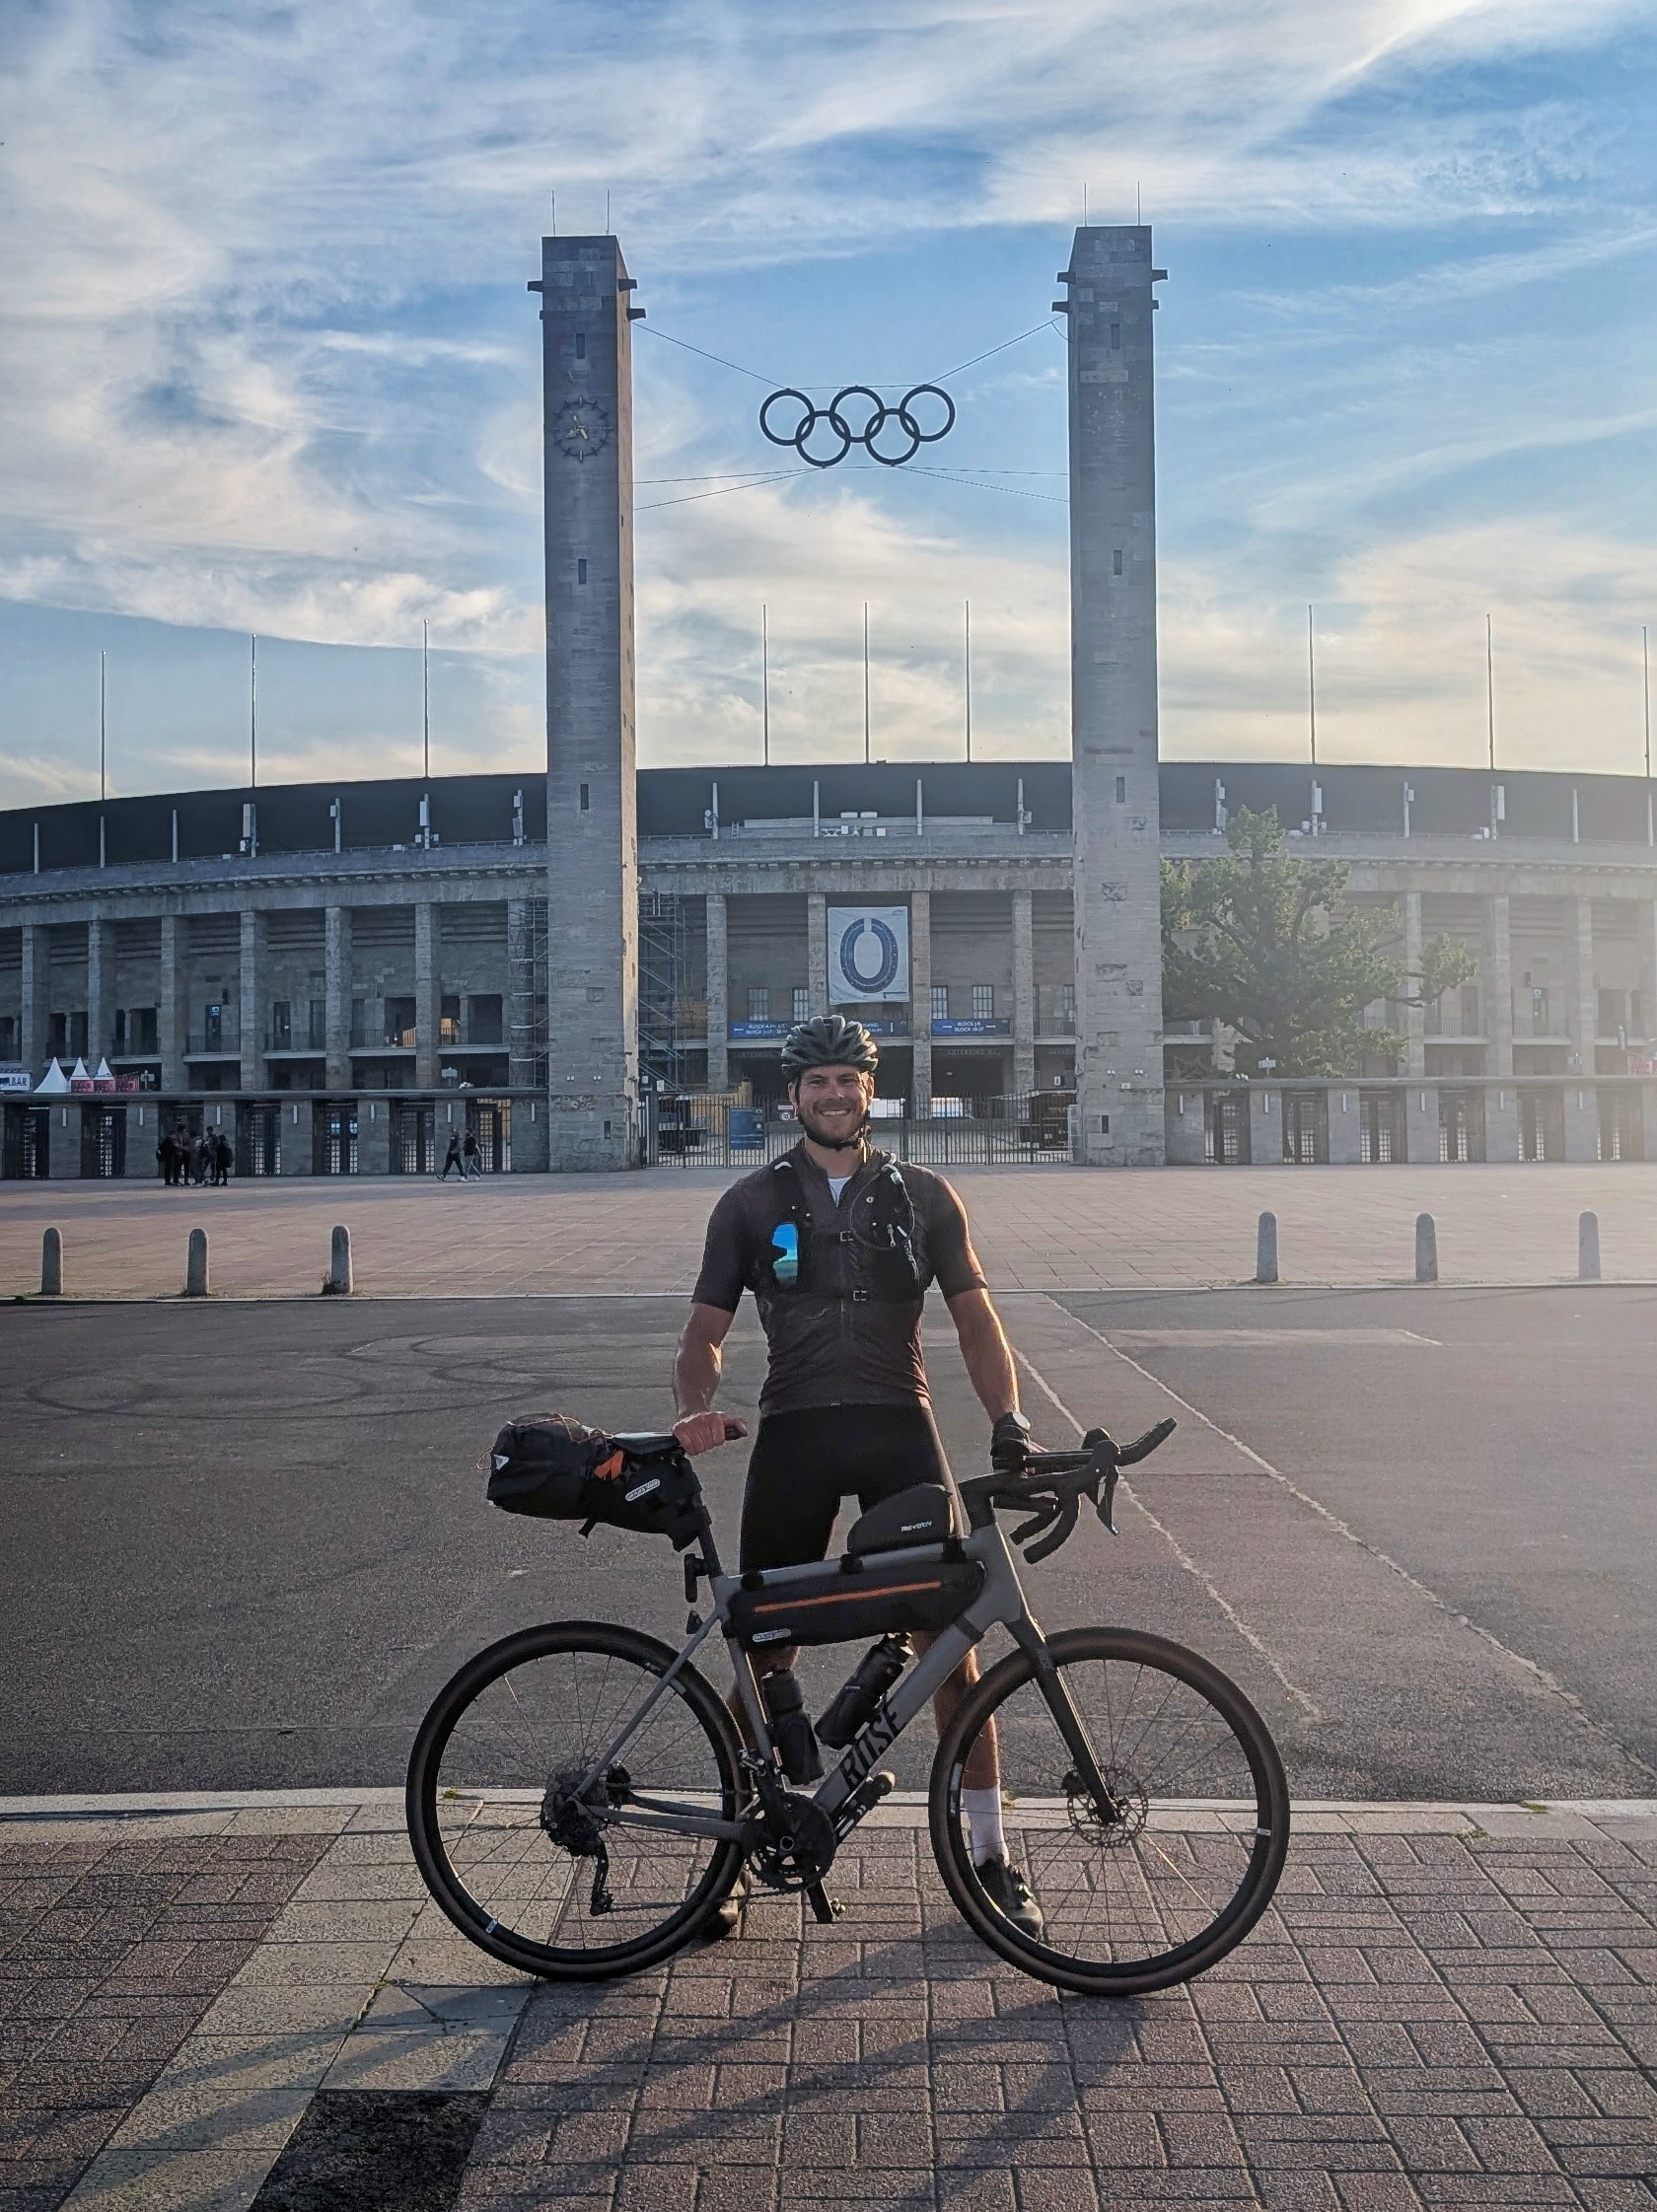
The year 2025 had two main focuses for me in terms of sports: playing basketball in the 1. Regionalliga and having some summer-fun on my new roadbike while going for longer distances overall.
As a software engineer, just looking at the standard Garmin app was not enough for me. I wanted the raw data to understand exactly how my training evolved. To generate the charts below, I wrote a custom Python script that downloads my data from the Garmin Connect API. It uses pandas to clean and aggregate the metrics, and matplotlib and seaborn to render the visualizations.
Even though I now track almost all of my workouts, or follow up on workouts where I can’t wear or take a tracker, using scripts, it’s possible that some data is incorrect because I forgot to enter something or changed my tracking behavior.
Here is what the evolution of my training looked like, comparing 2024 to 2025.
📊 Year-over-Year Core Metrics
To put the numbers into perspective: 704 hours of training means almost two hours of physical activity every single day of the year or 13.5 hours a week on average. While the total time spent training dropped slightly compared to 2024, the overall intensity, measured by active calories, increased.
| Metric | 2024 | 2025 | Delta |
|---|---|---|---|
| Total Time | 778.6 h | 704.0 h | -9.6% |
| Avg. Time / Week | 14.9 h | 13.5 h | -9.4% |
| Activities | 822 | 864 | +5.1% |
| Activities / Week | 15.8 | 16.6 | +5.1% |
| Distance | 7,279 km | 6,056 km | -16.8% |
| Elevation | 57,256 m | 44,117 m | -22.9% |
| Active Calories | 359,749 kcal | 425,187 kcal | +18.2% |
| Avg. kcal / Activity | 437.7 kcal | 492.1 kcal | +12.4% |
Consistency & Recovery
Looking at the cumulative training hours, 2024 featured a spike in late summer for my longest bikepacking trip yet, whereas 2025 followed a bit more linear, consistent accumulation of training load. Notice the divergence in Q1: 2024 shows a rapid accumulation of hours due to heavy winter cycling, whereas the 2025 curve reflects a more basketball-centric start to the year, without a lot of additional activities.
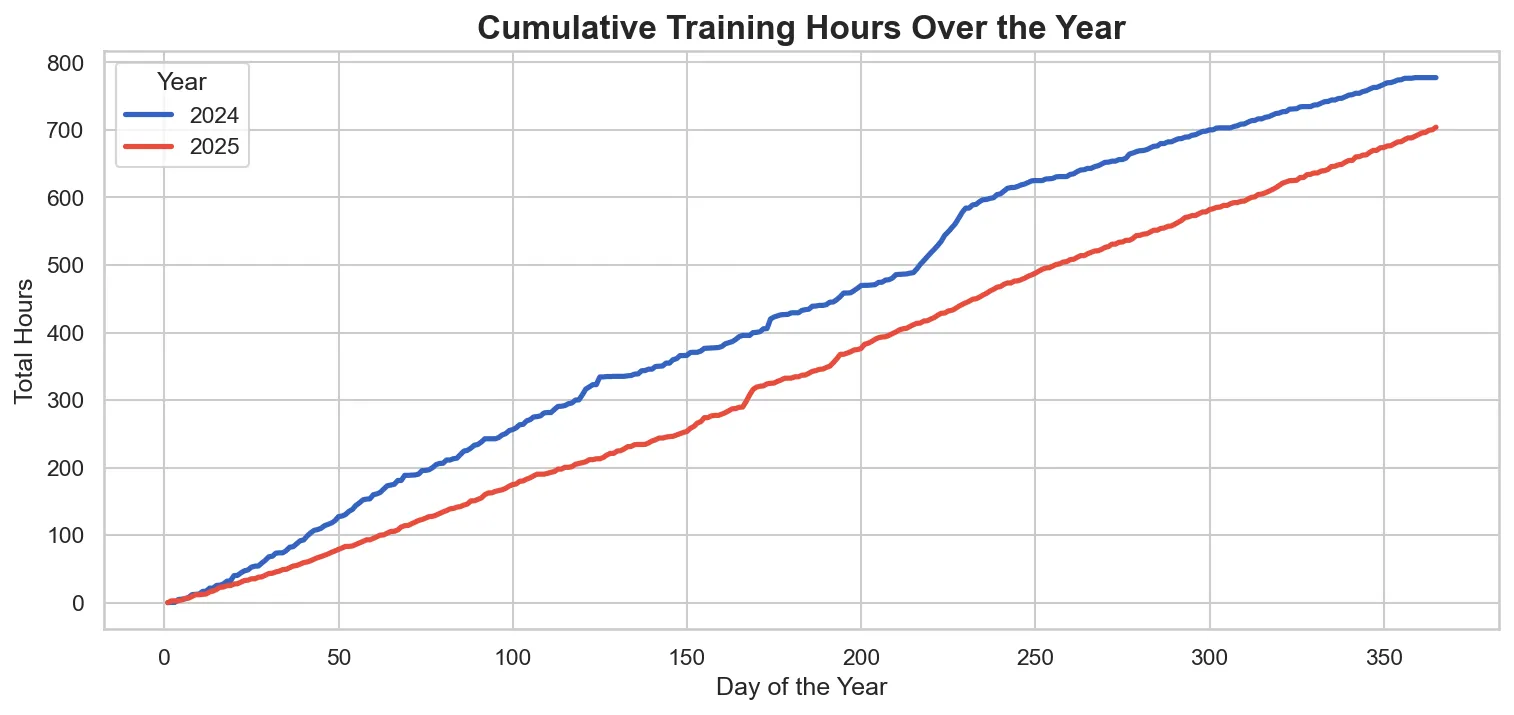
This steadier rhythm is directly reflected in the recovery metrics. The number of full rest days decreased to 38, and my longest active streak stretched to 47 consecutive days. There was no strict master plan to take exactly 38 days off—it’s just how the year organically played out. (Note: With Garmin I also track every daily bike commute, which naturally boosts the active streak count).
| Metric | 2024 | 2025 | Delta |
|---|---|---|---|
| Full Rest Days | 52 | 38 | -26.9% |
| Longest Active Streak | 33 days | 47 days | +42.4% |
| Longest Off Streak | 6 days | 2 days | -66.7% |
🏆 2025 Season Highlights
Not every workout is the same. Here are some extreme outliers of my year or noteworthy facts:
- 🏀 Basketball Consistency: Averaging ~8 hours/week of basketball in-season.
- ⏱️ Longest Workout: 9.8 hours on June 17th (Cycling).
- 📏 Max Distance: 276.0 km on June 17th (Cycling).
- 🔥 Highest Burn: 5,180 kcal in a single session on July 13th.
- 🚀 Fastest Ride (>50km): 33.4 km/h average over 50.6 km on July 19th.
📈 Calories, Nutrition & Fueling
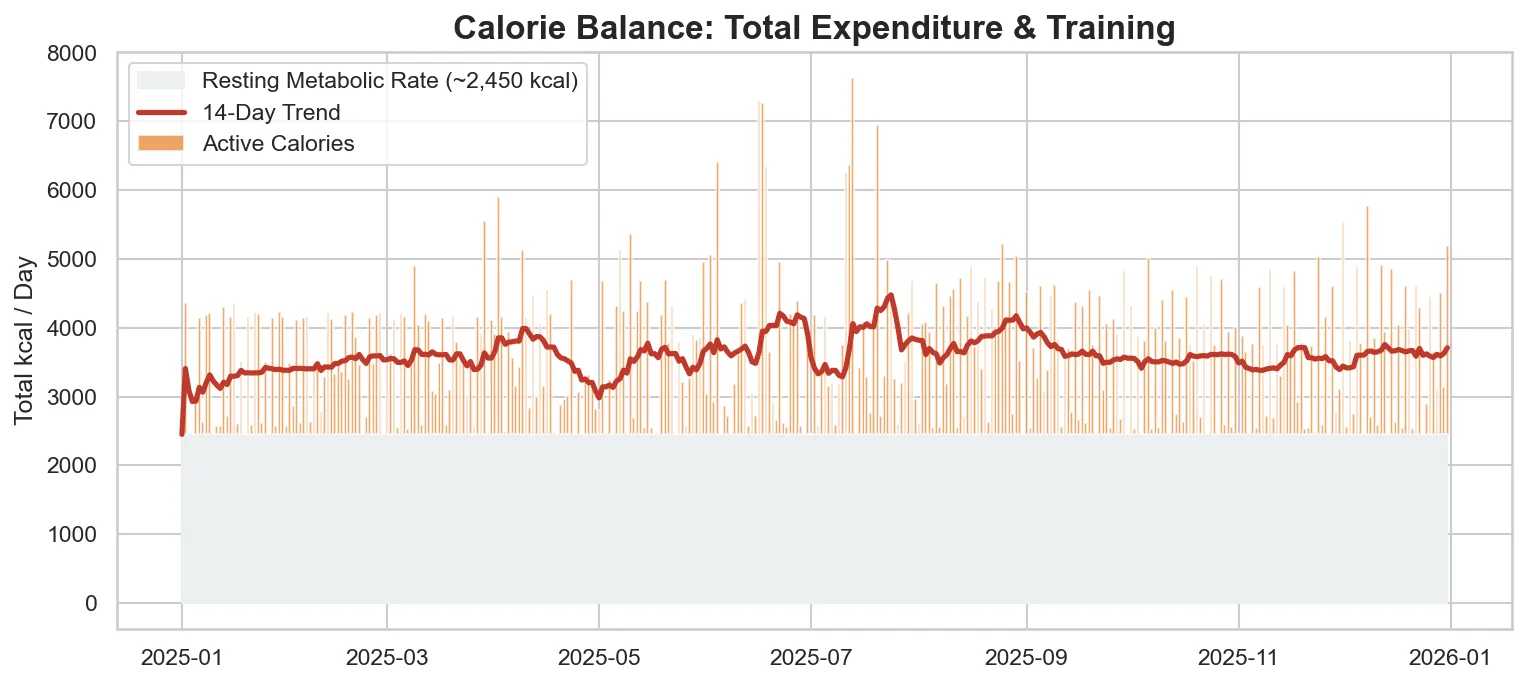
Active calories only tell half the story. The chart below stacks my training calories on top of my estimated resting metabolic rate (~2,450 kcal).
For me, the biggest challenge is nutrition. On long cycling days, the caloric deficit is massive and almost impossible to refill immediately. With basketball, I usually have to force myself to eat a large meal late at night after practice. On average, I burned about 3,615 calories every single day in 2025—the equivalent of eating about 4.5 frozen pizzas every day just to maintain weight.
When comparing the distribution of active calories per workout day between the two years, an interesting trend emerges.
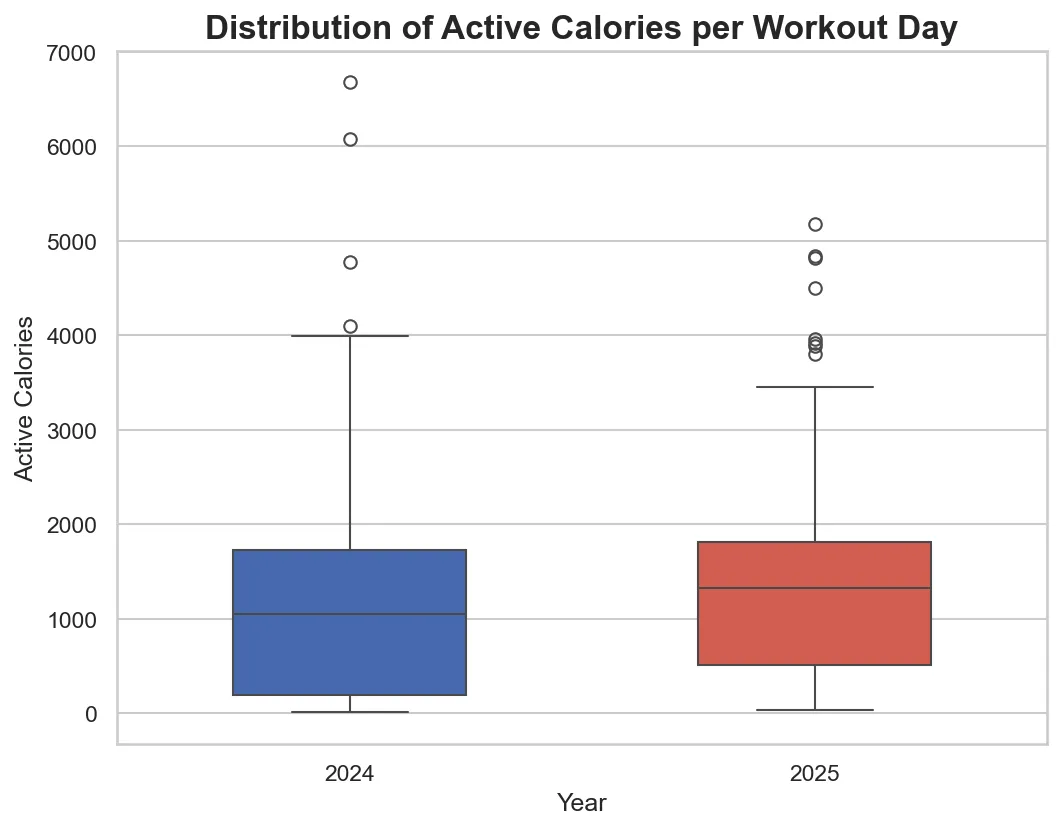
While 2024 had a few extreme outlier days (pushing near 7,000 active calories from long cycling days), 2025 maintained a visibly higher median active calorie burn per workout day.
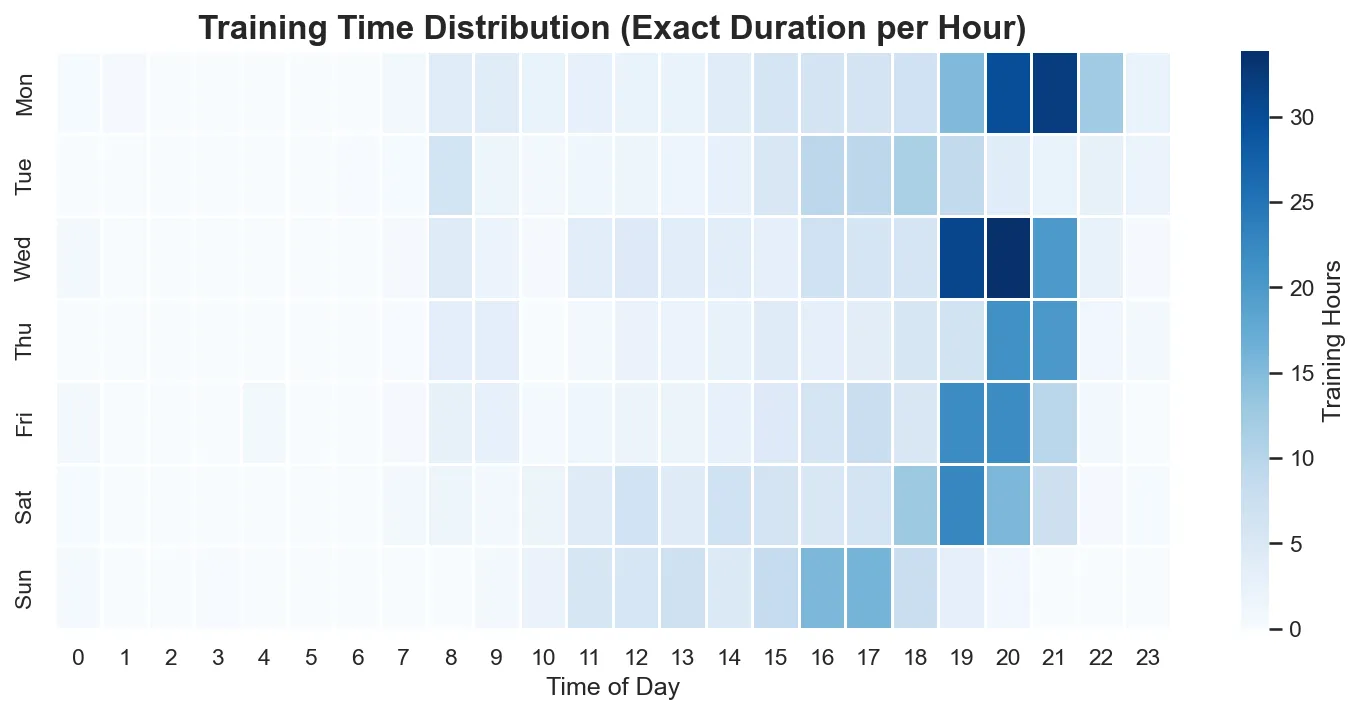
⏰ Training Times & Rhythm
It is also interesting to see when I train. The heatmap for 2025 shows a very clear pattern of my daily routine. Team practices in the gym always take up the late evening hours during the week on the same days. Saturday evening we can see a visible pattern for basketball game days. On Sundays, my (mostly) recovery sessions are usually much earlier during the day, and then I enjoy a relaxed Sunday evening.
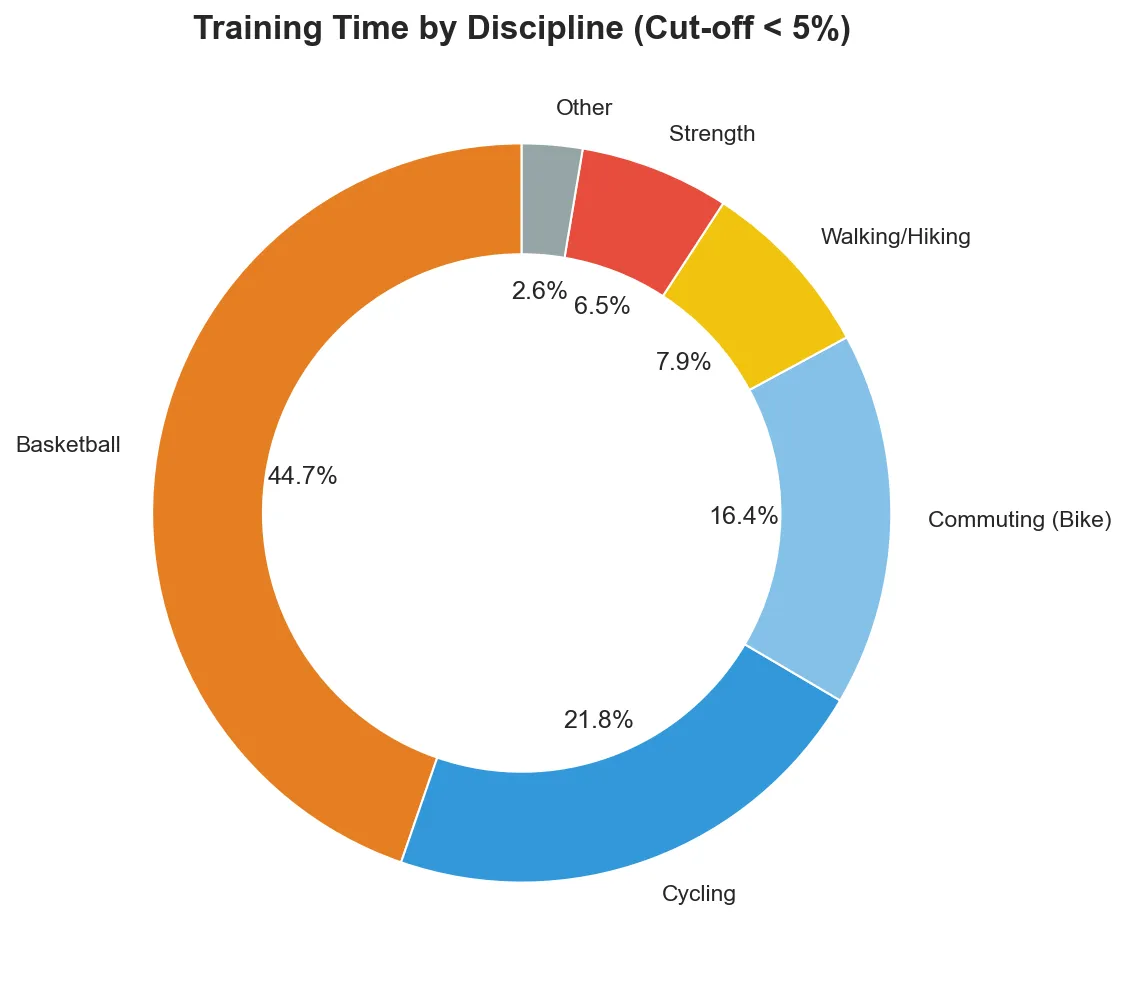
📉 Time Allocation & Seasonal Shifts
My training time is primarily split between basketball and cycling.
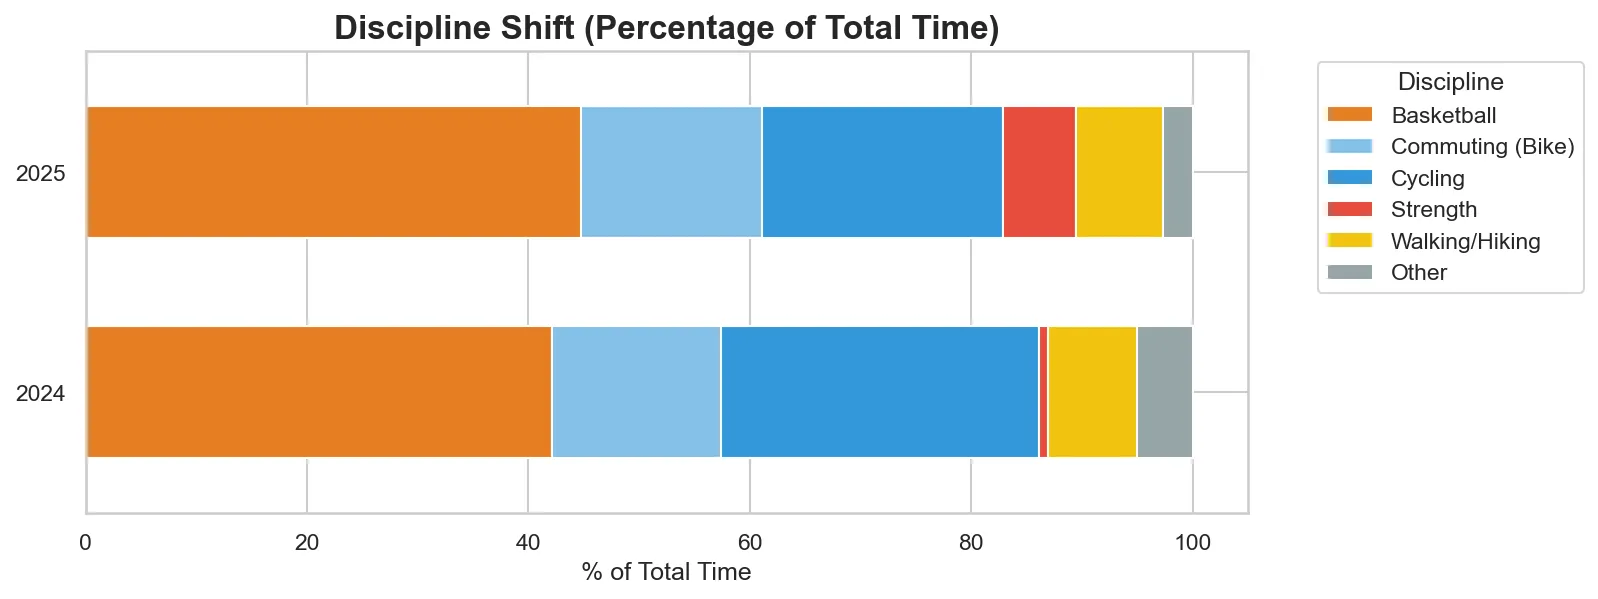
The discipline shift chart highlights the biggest changes in my routine. The proportion of time spent on the bike decreased, while strength training expanded significantly. The monthly breakdowns show exactly when these shifts happened.
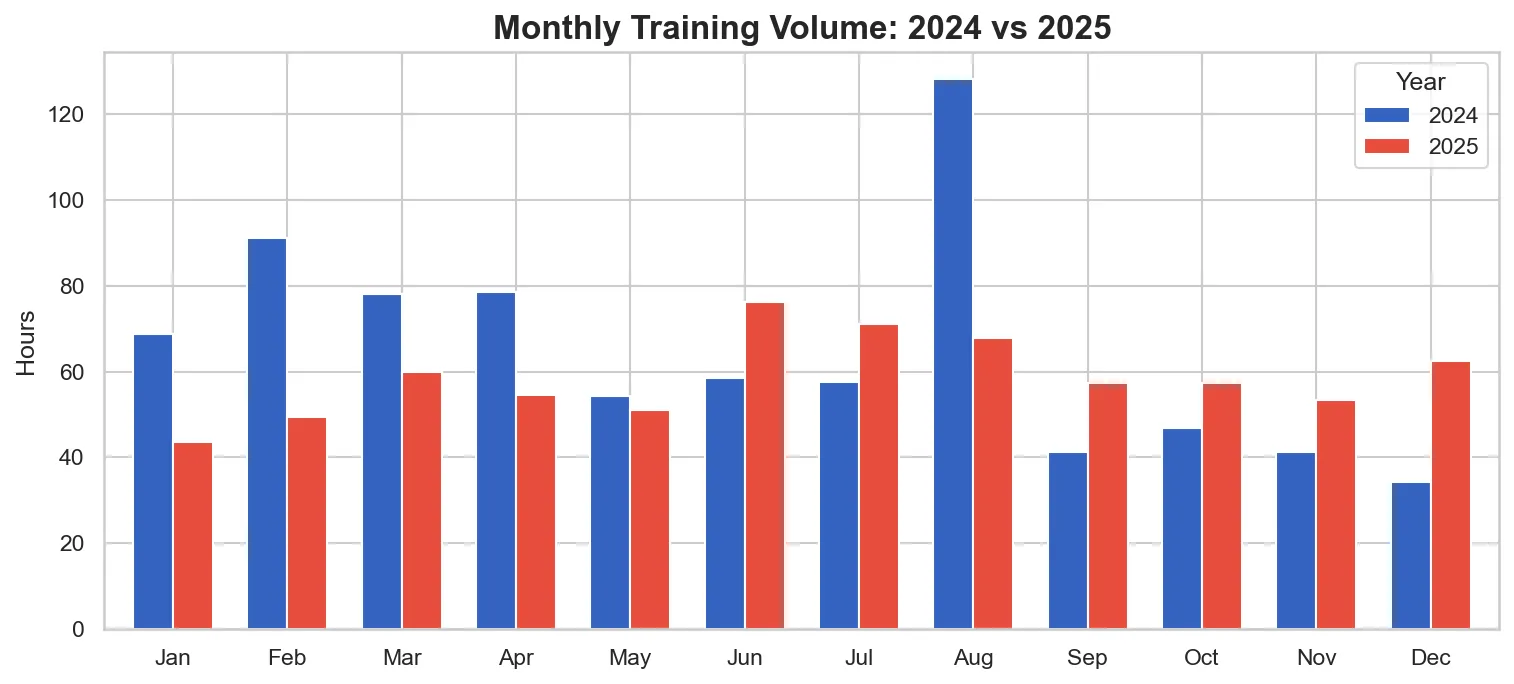
In 2024, August was an extreme outlier with over 120 hours of training. This is my 2000+ Km bikepacking tour from Osnabrück to Straßburg and back. In 2025, the volume was distributed much more evenly.
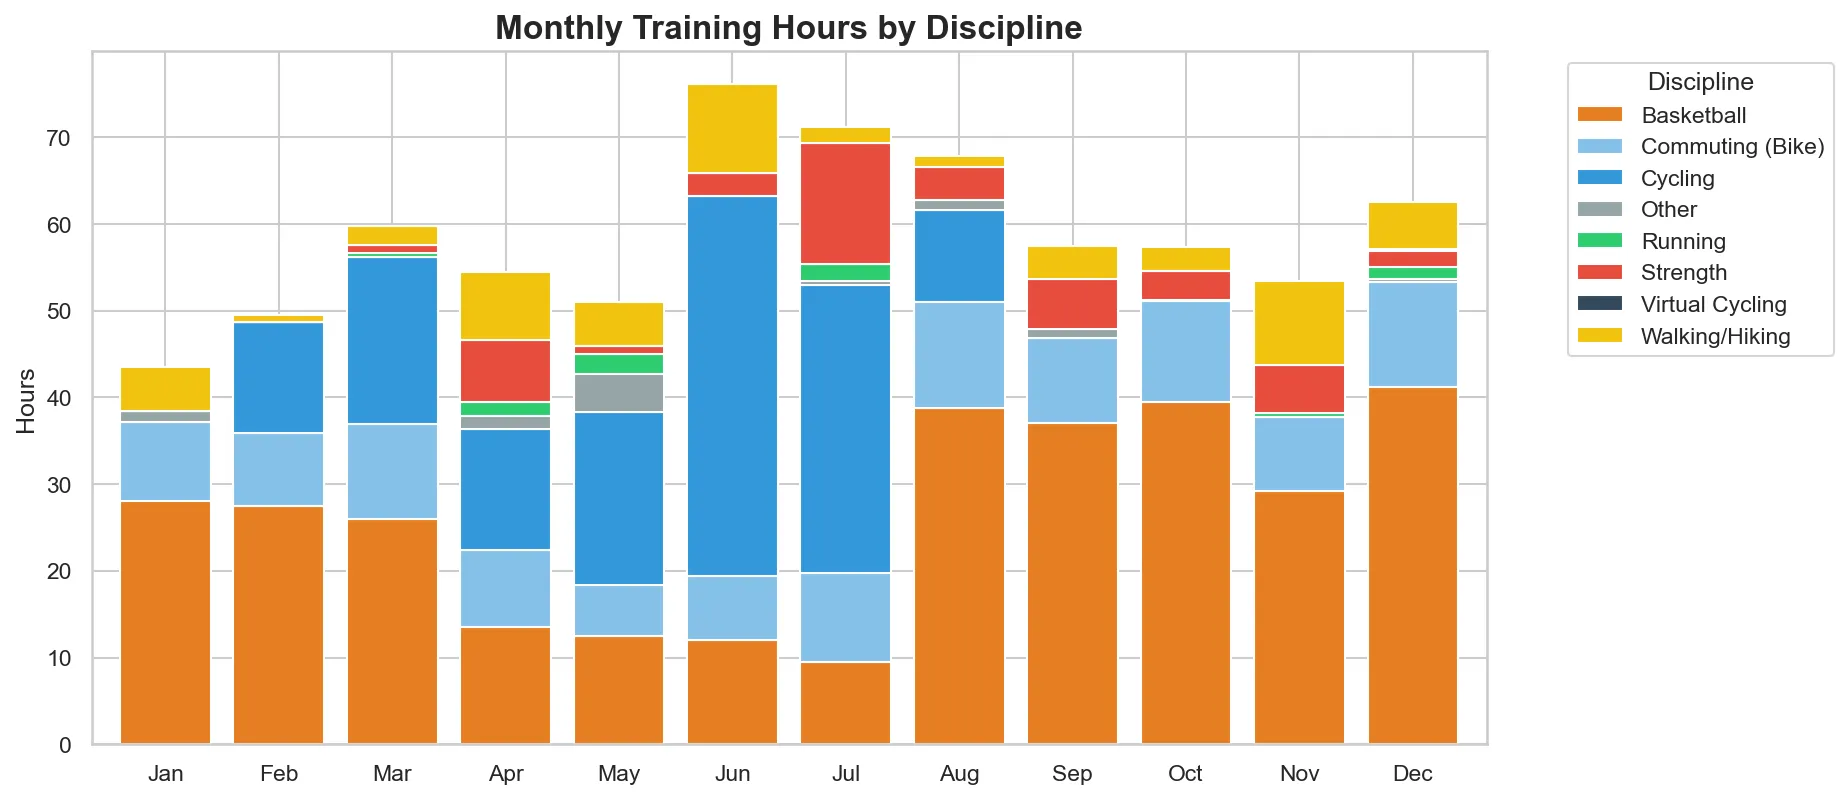
Looking at the specific 2025 breakdown, July shows the highest volume in the gym. This was the most intensive part of the basketball pre-season—focusing on jump improvements, strength, and power building. In August, I joined the new team in the 1. Regionalliga, and you can see the basketball volume increasing sharply. During the actual season, gym sessions shifted to shorter “activation” workouts right before team practice.
🚴 Deep Dive: Cycling & Commuting
| Metric (Cycling) | 2024 | 2025 | Delta |
|---|---|---|---|
| Total Time | 223.9 h | 153.7 h | -31.4% |
| Distance | 5,203 km | 4,136 km | -20.5% |
| Elevation | 39,015 m | 29,932 m | -23.3% |
| Metric (Commuting) | 2024 | 2025 | Delta |
|---|---|---|---|
| Total Time | 118.5 h | 115.1 h | -2.8% |
| Activities | 484 | 542 | +12.0% |
| Distance | 1,677 km | 1,588 km | -5.3% |
Since basketball and the gym are always indoors, cycling is the perfect counterweight. On the bike, I’m not dependent on a team or a schedule.
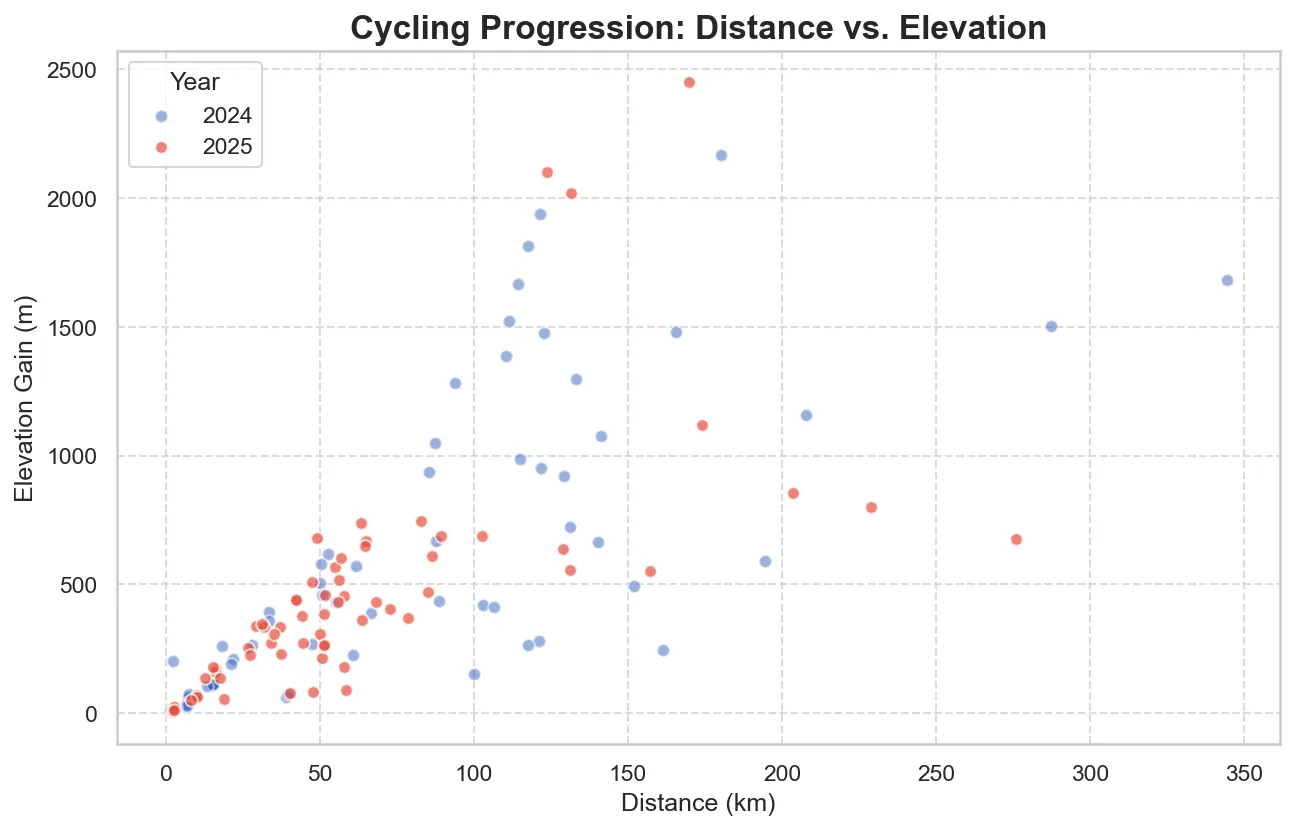
The scatter plot shows that 2024 featured more extreme endurance rides, pushing toward 350 km in one single ride. In 2025, my rides clustered more efficiently around the 50-150 km range with moderate elevation.
🚶 Deep Dive: Walking/Hiking
| Metric | 2024 | 2025 | Delta |
|---|---|---|---|
| Total Time | 63.2 h | 55.8 h | -11.6% |
| Distance | 217 km | 220 km | +1.4% |
| Elevation | 4,056 m | 2,102 m | -48.2% |
In 2024, we went on vacation to Madeira. If you look at the elevation gain while hiking, you can clearly see the route we took.
Conclusion: Balance between Team & Solo Sports
Looking at the final distribution, 2025 was a year of constant adaptation. Basketball and cycling are my two main pillars, but they serve completely different purposes for me. Basketball is my primary sport and simply a lot of fun. I love being in a competitive environment with a group of guys who are all highly motivated and putting in extra work.
However, since basketball and the gym are always indoors, cycling has become the perfect counterweight. I originally started because it’s the best way to get outside and clear my head. On the bike, I’m not dependent on a team or a schedule; I can push myself solo or just go for a low-effort ride if I need a break. It’s that mix of being outdoors and having time for myself that makes it so interesting.
The gym remains strictly a tool for me. I could never do bodybuilding or fitness as my “main” sport. Every hour I spend lifting is purely to become a better athlete on the court and stronger on the bike, focusing on injury prevention and functional power rather than aesthetics.
One thing the data doesn’t show is how much my body has to adapt between these two worlds. Even though cycling builds a massive aerobic base, the physical setup for basketball is completely different. Every year after the cycling-heavy summer season, I feel the transition.
My legs are used to the steady, linear motion of pedaling, so the vertical explosiveness and the lateral movements on the court take a hit at first. It usually takes a few weeks of specific training to get my “jumping legs” back and for my joints to get used to the hard impacts of the hardwood floor again. Balancing these two is a process of recalibrating the body.
Looking ahead to 2026, the goals are straightforward. I want to finish my first semi-professional season in the 1. Regionalliga strong and push my cycling limits even further. I’m planning to experiment more with ultra-cycling distances and want to increase my total yearly mileage. Since I’ve added an indoor trainer to my setup recently, I’m particularly curious to see how the time distribution will shift in the next year’s review.
Data extraction, aggregation, and visualization built with Python (Garmin API, Pandas, Seaborn, Matplotlib).